Sedans, SUVs and Pickups: How America’s New-Vehicle Mix Changed
From the station wagon to the minivan and the crossover, follow how America’s family car changed over 50 model years.

On an American suburban street in the late 1970s, the family car might have been a station wagon with a long roof and a tailgate low enough for a kid to sit on. It could handle the school run all week, then take a family and its luggage out of town on Saturday.
When the family car sat low
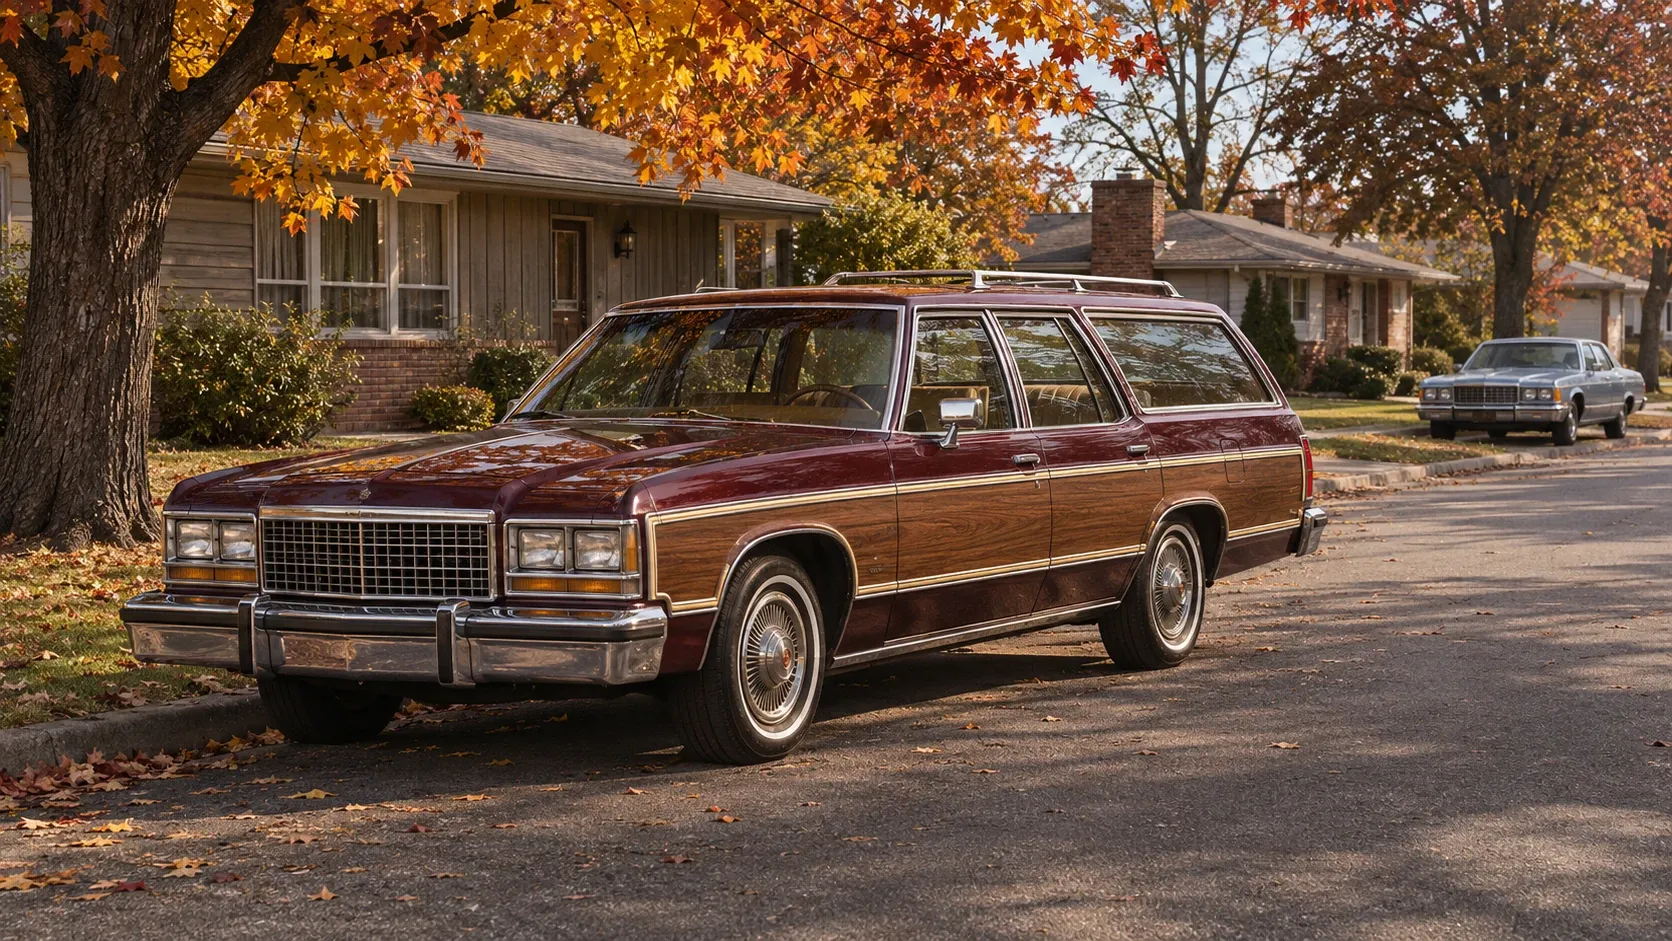
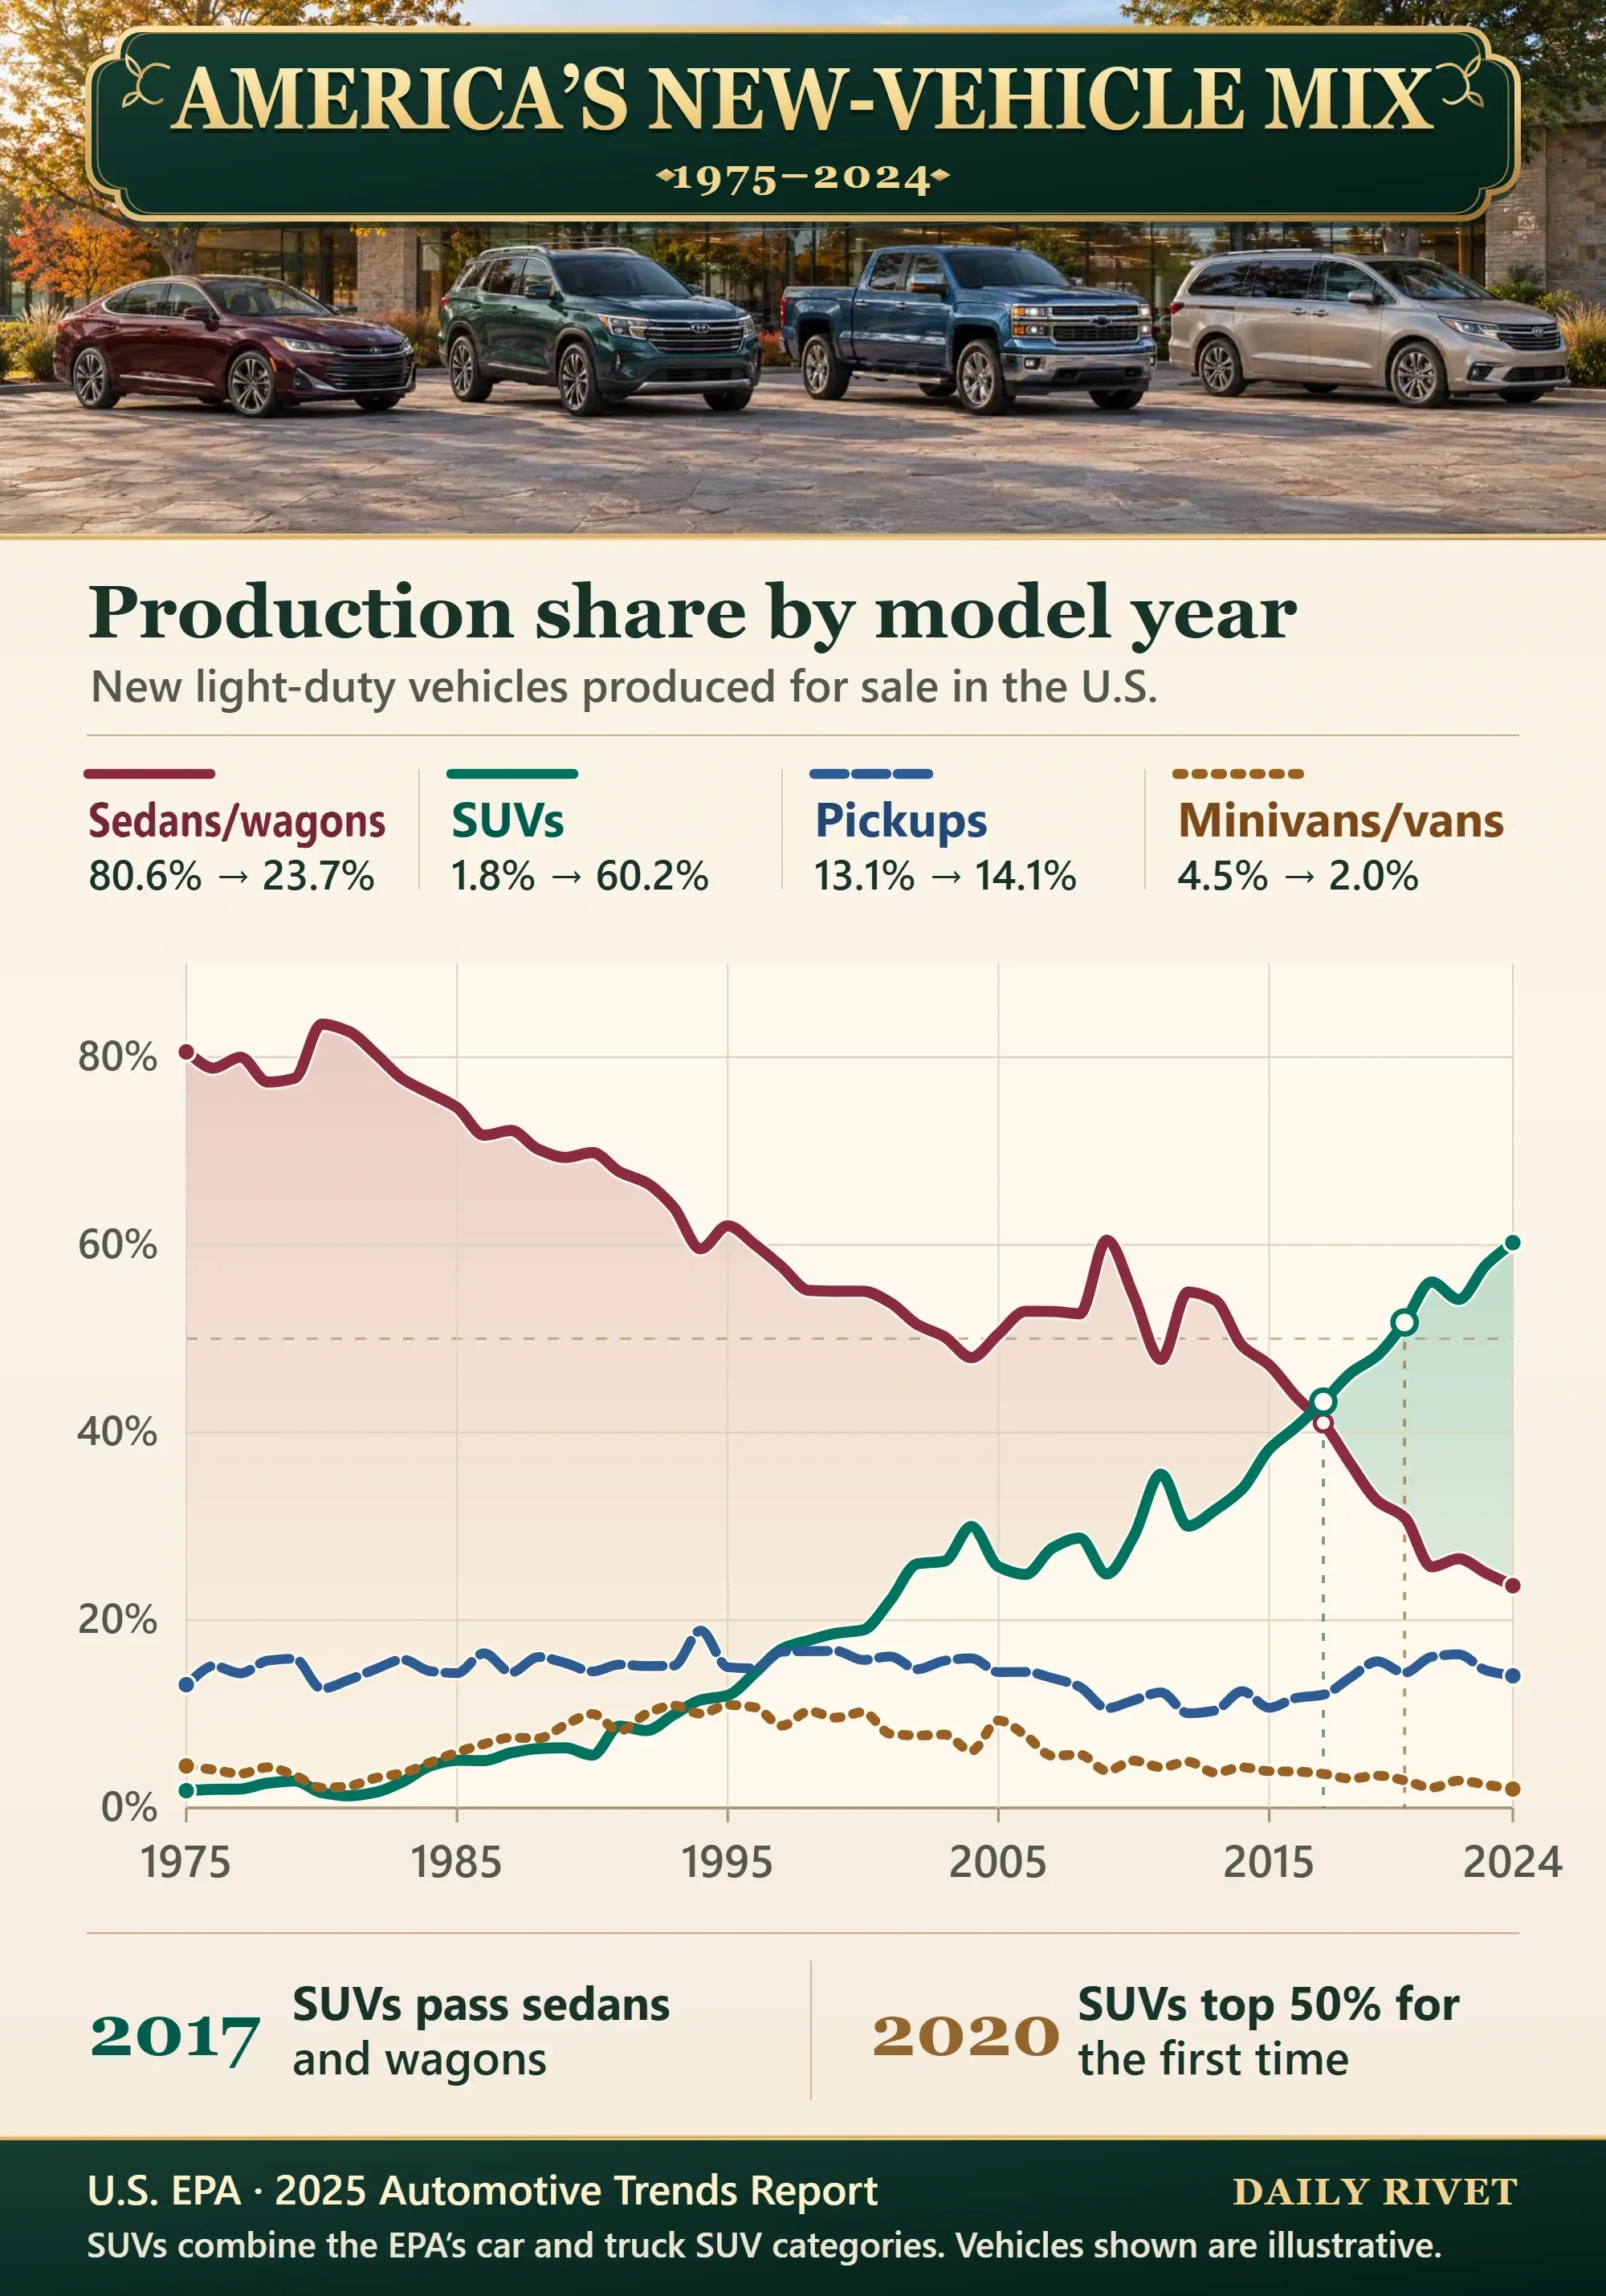
In 1975, about four out of five new light-duty vehicles produced for U.S. sale fell into the EPA’s sedan and wagon group, which also includes coupes and hatchbacks. The group peaked at 83.5% in 1980. A wagon’s long roof left room for a dog or a stack of suitcases behind the back seat.
The minivan makes room
The 1984 Plymouth Voyager was shorter than a typical station wagon and could seat seven. Its tall cabin and sliding side door made it easier to get people and gear in and out.
By 1995, minivans and vans together made up 11.0% of new-vehicle production for the U.S. market, their high point in the EPA’s series. That same year, SUVs were already close at 12.0%.
The SUV takes on the school run
When the Toyota RAV4 arrived in the U.S. in 1996, it gave buyers an early look at a compact crossover. It put a higher seating position and wagon-like cargo space on a small, car-like vehicle. In 2018, the U.S. Energy Information Administration found that car-based crossovers often had fuel economy only slightly below comparable cars.
The SUV share was about one in five new vehicles produced for U.S. sale in 2000 and about one in three in 2014. Over the next decade, that share rose by 26.2 percentage points, the largest ten-model-year gain in the EPA series. SUVs passed sedans and wagons in 2017 and crossed 50% in 2020. By 2024, SUVs were at 60.2%, while sedans and wagons had slipped to 23.7%.
What changed at the curb
The pickup’s production share rose to 18.9% in 1994, fell to 10.1% in 2012 and landed at 14.1% in 2024, close to where it started in 1975. The EPA’s combined minivan and van category was down to 2.0% in 2024.
The EPA found that fuel economy improved within each vehicle type over the long run. Moving production toward types that typically used more fuel ate into some of those gains across the new-vehicle fleet.
The EPA’s 2025 Automotive Trends Report measures new light-duty vehicles produced for U.S. sale, including imports, by model year. The chart covers the final figures for 1975–2024. SUVs combine the EPA’s car-SUV and truck-SUV categories. The EPA reports minivans and vans as one group.
Recommended