How Movie Ticket Prices Have Changed Over the Years
From Depression-era double features to Avatar in 3-D, here’s how inflation and changes in the theater business shaped what we pay for a movie.

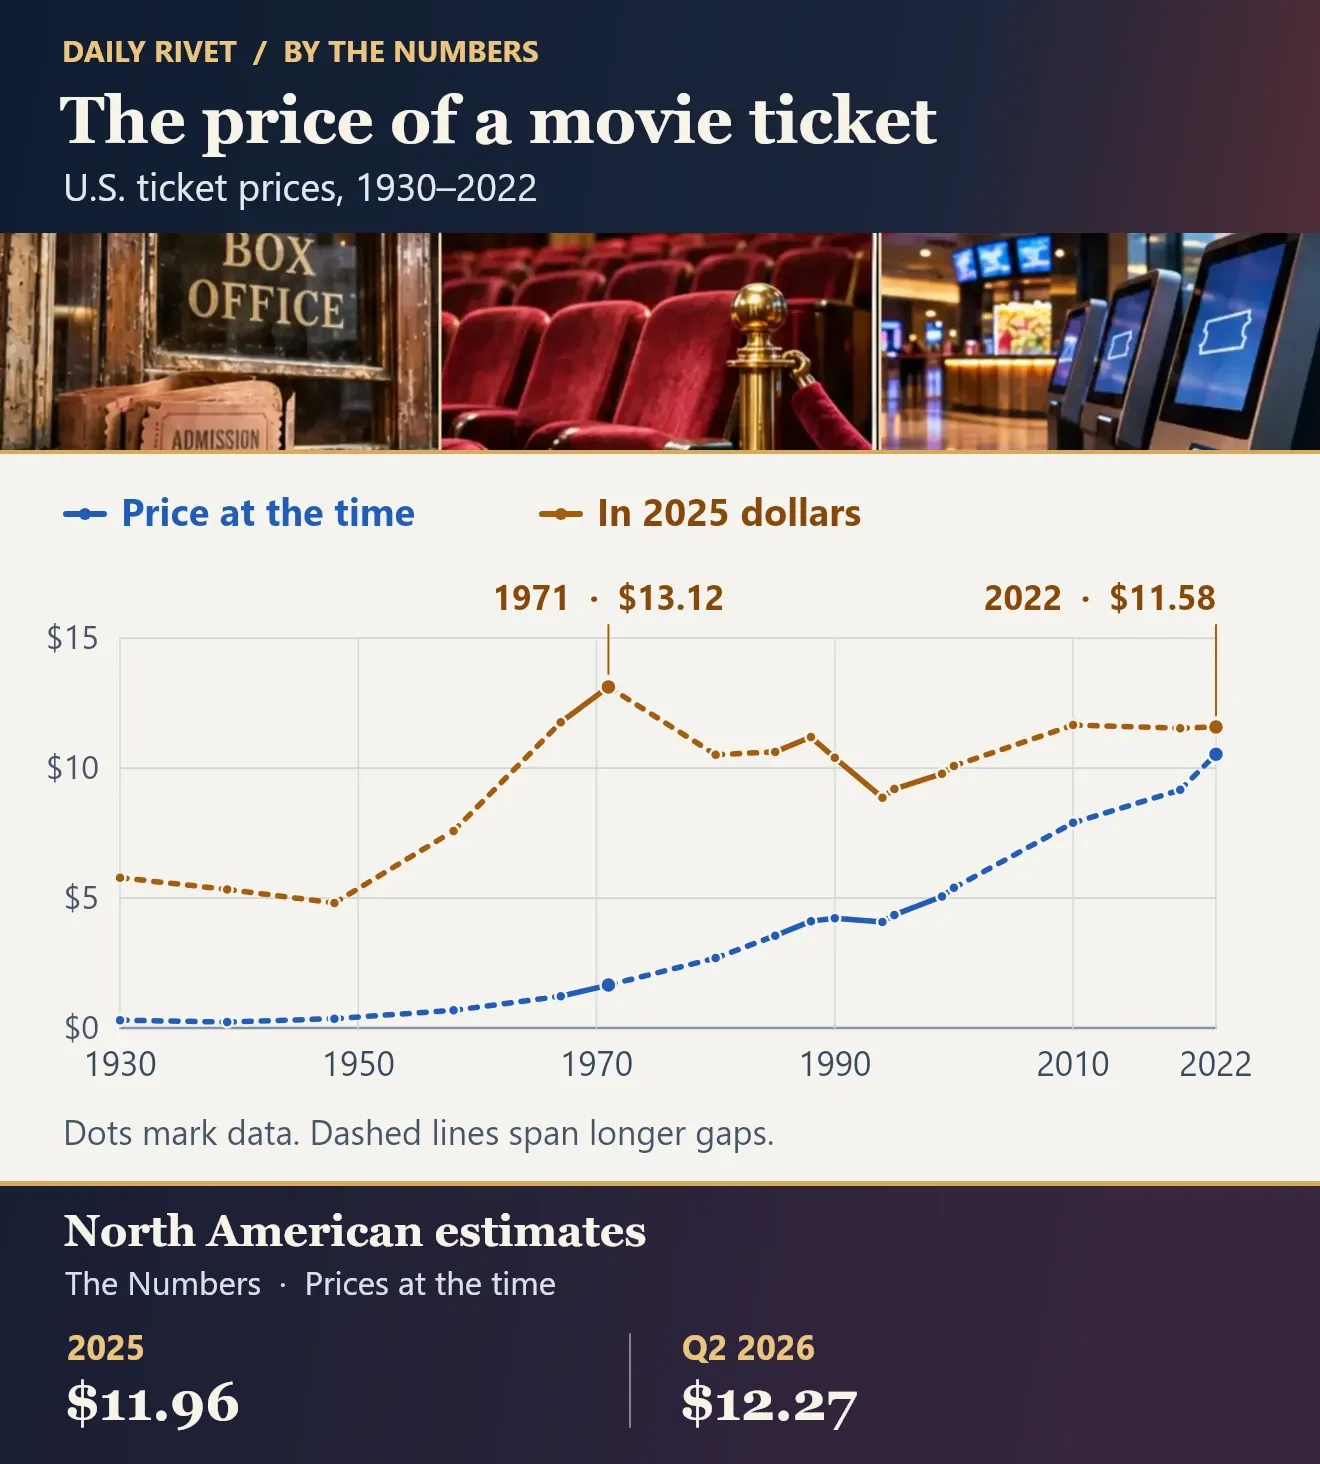
In 1971, the average U.S. movie ticket cost $1.65. By 2022 it was $10.53, yet the 1971 ticket cost about $1.50 more once both prices are put in 2025 dollars. Over those decades, the dollar lost purchasing power, and the business of filling a theater changed. During the Depression, a double feature gave people a reason to come back. By the time Avatar came out, a 3-D screening gave theaters a reason to charge more.
When theaters sold two movies for the price of one
A nickel got you into a Pittsburgh nickelodeon in 1905. A generation later, some of the grand movie palaces were cutting prices of their own. During the Depression, they pared back live stage shows and offered double features, giving customers two films on one ticket. Some opened refreshment stands to bring in money beyond the box office. The 23-cent admissions in the chart come from an era when theater owners were trying to keep people coming through the door.
Television changed what was playing
After World War II, audiences dwindled as Americans found other ways to spend their evenings, including watching television at home. Studios responded by making fewer movies, especially the low-budget features that often came with cheaper admission. Economists Barak Orbach and Liran Einav trace part of the postwar rise in average ticket prices to the disappearance of those bargain seats. By 1967, the average U.S. admission was $1.22.
By the early 1970s, theaters were settling into the pricing most of us remember. A theater generally charged the same regular admission for the big new release as for the other movies it was showing. You could still save by going to a matinee. The average price at the box office barely moved between 1988 and 1994, from $4.11 to $4.08. Over those six years, prices elsewhere rose enough that the average movie ticket got about 21% cheaper after inflation.
Then theaters had something new to charge for
As theaters switched to digital projection, they could show a film in standard 2-D and charge more for the 3-D version. Avatar showed how much that could matter. It was the biggest film at Marcus Theatres in its 2010 fiscal year, and most of the chain’s box-office revenue from the movie came from higher-priced 3-D showings. Marcus’s average ticket price rose 7.7% that year. The company attributed the rise mainly to some ticket price increases and the extra charge for digital 3-D and its biggest screens.
The same pattern showed up at AMC in 2025. Its average U.S. ticket price rose 4.6% as the chain raised prices across formats and more people went to 3-D, IMAX and other large-screen shows. That’s how even a theater with a discount night can sell a more expensive ticket on average. AMC can cut the base price of a Tuesday show and still charge extra if you choose IMAX.
For the U.S. as a whole, the average ticket rose from $9.16 in 2019 to $10.53 in 2022, roughly in line with inflation. The most recent figure in the chart, $12.27 for the second quarter of 2026, is a separate estimate for North America. Your own receipt will depend on where you go, when you go and which screen you pick.
Movie ticket prices by year
Selected U.S. averages and historical estimates, with two recent North American estimates at the bottom.
| Year | Price at the time | In 2025 dollars |
|---|---|---|
| 1939 (estimate) | $0.23 | $5.33 |
| 1948 | $0.36 | $4.81 |
| 1958 | $0.68 | $7.58 |
| 1967 | $1.22 | $11.76 |
| 1971 | $1.65 | $13.12 |
| 1980 | $2.69 | $10.51 |
| 1985 | $3.55 | $10.62 |
| 1988 | $4.11 | $11.19 |
| 1990 | $4.22 | $10.39 |
| 1994 | $4.08 | $8.86 |
| 1995 | $4.35 | $9.19 |
| 1999 | $5.06 | $9.78 |
| 2000 | $5.39 | $10.08 |
| 2010 | $7.89 | $11.65 |
| 2019 | $9.16 | $11.53 |
| 2022 (U.S. survey) | $10.53 | $11.58 |
| 2025 (North America) | $11.96 | — |
| Q2 2026 (North America) | $12.27 | — |
Prices cover admission only. Historical prices in 2025 dollars equal the original price × 321.943 ÷ that year’s annual all-items CPI-U. The two North American estimates are in dollars at the time.
Sources
- Billboard: Pittsburgh nickelodeons (1905)
- Richard Butsch: Depression-era moviegoing
- Orbach and Einav: theater pricing (2007)
- Marcus: 2011 annual filing
- AMC: 2025 annual filing
- AMC: discount terms
- Theater owners’ association: historical ticket prices (2019)
- Cinema Foundation: U.S. ticket-price survey (2023; no 2020–2021 averages)
- The Numbers: North American estimates (September 2026)
- BLS: historical CPI-U
- BLS: recent annual CPI-U averages
- BLS: 2025 CPI methodology (11 published months)
Recommended