The Companies Building the Most Homes in America
D.R. Horton and Lennar dominate U.S. homebuilding. See the 20 companies that closed the most homes in 2025—and how wide the gap is at the top.

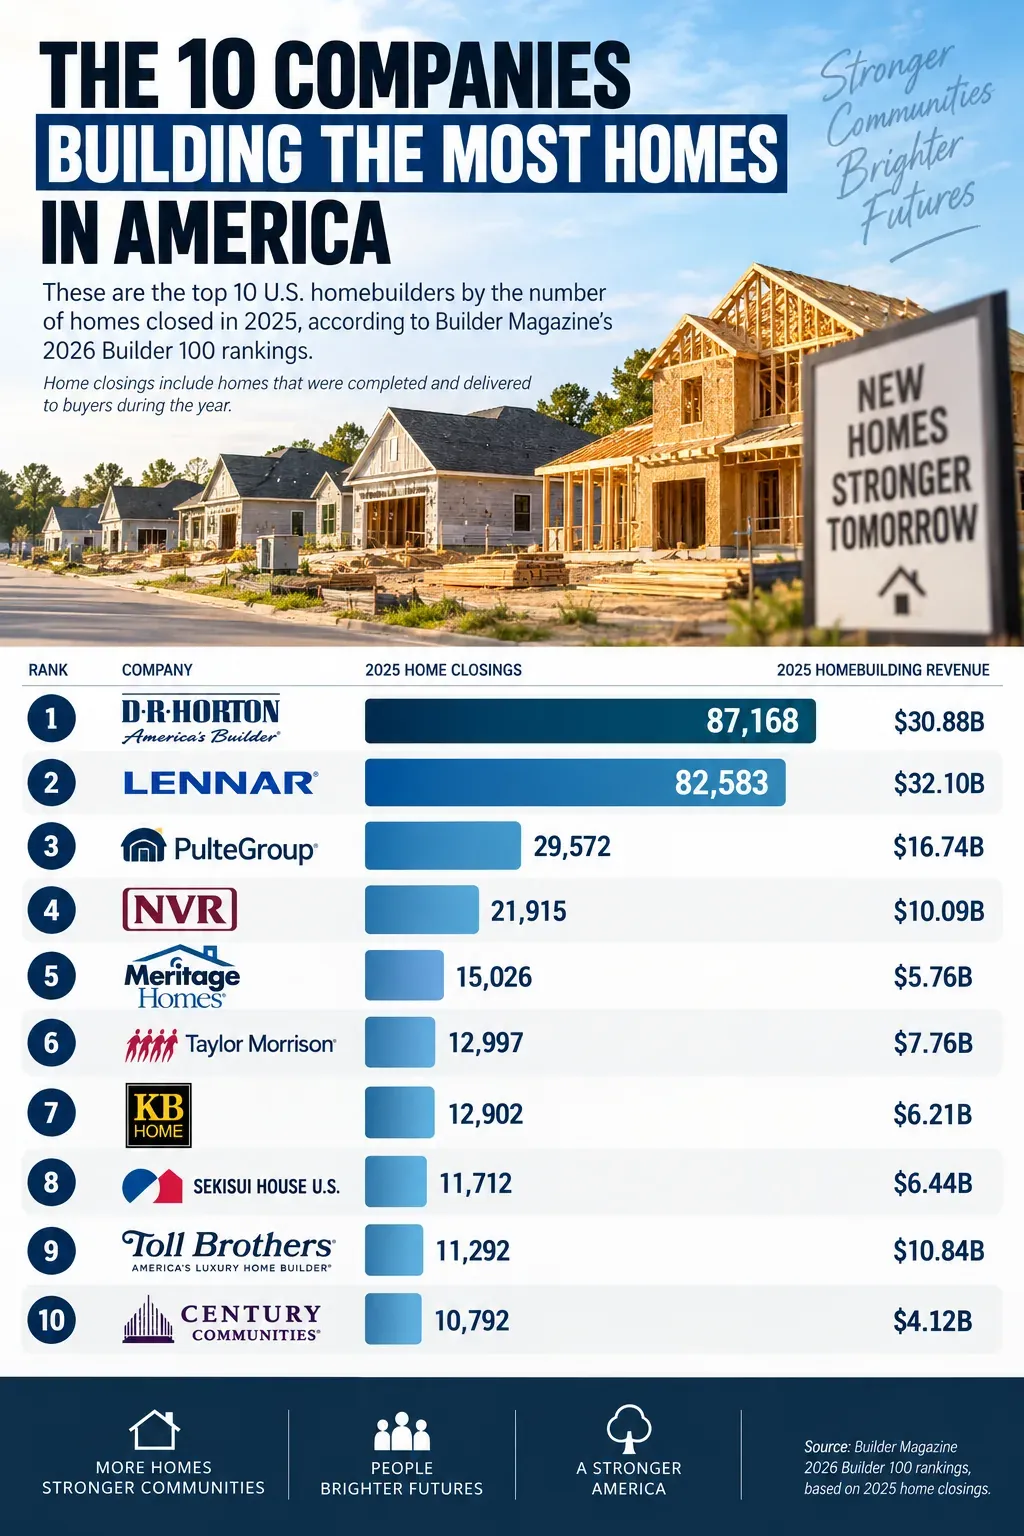
D.R. Horton and Lennar finished close together at the top of America’s homebuilding rankings. The distance between them and everyone else was much larger: Horton recorded 87,168 closings in 2025, Lennar recorded 82,583, and third-place PulteGroup finished with 29,572. Even doubling PulteGroup’s annual total would leave it well short of either leader.
That gap is the starting point for this ranking of the 20 largest U.S. homebuilders. But the revenue column tells another story, and some of the corporate names conceal brands that buyers are more likely to recognize on a neighborhood sign. Here is how the companies compare, using the 2026 Builder 100’s figures for 2025.
The 20 Largest Homebuilders in America, Ranked
This ranking uses Builder’s 2026 Builder 100, which reports 2025 home closings and homebuilding revenue from its annual survey. A closing generally marks the completed sale and delivery of a home. It is a different measure from construction starts: a home begun in one year may close in the next.
Figures below follow Builder’s published dataset. Companies can have different fiscal year-ends, so the table should not be read as a count of homes physically constructed during one identical January-to-December period. Revenue is rounded to billions of dollars.
| Rank | Company | 2025 Home Closings | 2025 Homebuilding Revenue |
|---|---|---|---|
| 1 | D.R. Horton | 87,168 | $30.88 billion |
| 2 | Lennar | 82,583 | $32.10 billion |
| 3 | PulteGroup | 29,572 | $16.74 billion |
| 4 | NVR | 21,915 | $10.09 billion |
| 5 | Meritage Homes | 15,026 | $5.76 billion |
| 6 | Taylor Morrison | 12,997 | $7.76 billion |
| 7 | KB Home | 12,902 | $6.21 billion |
| 8 | Sekisui House U.S. | 11,712 | $6.44 billion |
| 9 | Toll Brothers | 11,292 | $10.84 billion |
| 10 | Century Communities | 10,792 | $4.12 billion |
| 11 | Ashton Woods Homes | 10,067 | $3.60 billion |
| 12 | Clayton Properties Group | 9,953 | $4.01 billion |
| 13 | M/I Homes | 8,921 | $4.28 billion |
| 14 | Dream Finders Homes | 8,608 | $3.92 billion |
| 15 | DRB Group | 6,960 | $2.96 billion |
| 16 | Hovnanian Enterprises | 6,430 | $3.48 billion |
| 17 | David Weekley Homes | 5,944 | $3.32 billion |
| 18 | Stanley Martin Homes | 5,320 | $2.39 billion |
| 19 | Tri Pointe Homes | 4,947 | $3.36 billion |
| 20 | LGI Homes | 4,788 | $1.71 billion |
Source: Builder Magazine’s 2026 Builder 100 rankings, based on 2025 home closings.
D.R. Horton and Lennar lead by home closings
Horton’s lead over Lennar was 4,585 homes. Lennar’s lead over PulteGroup was 53,011. The competition for first place was considerably closer than the competition for second, and that makes the first two rows worth reading together.
Between them, Horton and Lennar recorded 169,751 closings, about 46% of the combined total for these 20 builders. That percentage applies to this list, rather than the entire U.S. market. A national market-share calculation would need to include the homes delivered by builders outside the top 20 as well.
Farther down the table, annual volume falls in stages. PulteGroup and NVR each exceeded 20,000 closings, while Meritage Homes was the only builder between 15,000 and 20,000. Eleven companies passed 10,000; Clayton Properties Group finished just below that threshold at 9,953. Those distinctions are more useful than treating every company in the ranking as if it operated at the same scale.
The builder name on the sign may be different
NVR is a good example of how a corporate ranking can look unfamiliar even when its homes are not. The fourth-place company sells through Ryan Homes, NVHomes, and Heartland Homes. A buyer browsing a Ryan Homes community is therefore looking at part of the business listed here as NVR.
For readers trying to connect this table with construction near them, the brand relationship matters. The ranking measures companies, and the name used to market an individual community may be different from the one in the company column.
Keeping homes selling takes more than scale
A high closing count does not mean buyers accepted every asking price. In its fourth-quarter 2025 results, Lennar described using incentives, including mortgage-rate buydowns, to maintain sales momentum. Management reported roughly 14% in incentives and price adjustments during the quarter, alongside continued affordability pressures.
That detail gives the volume figures some context. Selling tens of thousands of homes can involve concessions that make a purchase easier for the buyer while reducing the builder’s margin. The closing count tells us how many homes changed hands; it does not show what the seller had to offer to get those deals across the line.
Toll Brothers ranks higher when revenue matters
Toll Brothers sits ninth by closings, but its approximately $10.84 billion in homebuilding revenue exceeds NVR’s $10.09 billion. NVR recorded 21,915 closings to Toll’s 11,292, so Toll generated more revenue despite delivering only a little over half as many homes.
The company’s focus on luxury housing helps explain the difference. In its fiscal 2025 results, Toll reported an average delivered home price of about $960,000. Count the homes and it places ninth; sort this table by revenue and it moves to fourth, ahead of NVR and behind PulteGroup.
For a ranking about who delivers the most homes, closings are the appropriate measure. Revenue answers a different question, one shaped by the prices and types of homes a builder sells.
How the top 20’s home closings add up
The companies listed here recorded 367,897 closings in total. This summary groups the same figures to show how much of that activity sits near the top of the ranking.
| Builder Group | Combined 2025 Closings |
|---|---|
| D.R. Horton + Lennar | 169,751 |
| Top 3 Builders | 199,323 |
| Top 5 Builders | 236,264 |
| Top 10 Builders | 295,959 |
| Top 20 Builders | 367,897 |
What the ranking tells a homebuyer
National volume is useful background when you want to understand the company behind a new development. It gives a sense of how large the business is and, alongside revenue, the kind of market it serves. It cannot tell you how well a particular house was built or how a local team handles problems after move-in.
If this list is the start of a home search, the next questions belong at the community level: what is included in the quoted price, what conditions apply to an incentive, and what does the warranty cover? Ask about the specific home and development you are considering. An annual closing total can put the seller in context, but the purchase still comes down to one property.
Recommended