How America’s 2.26 Billion Acres Are Actually Used
Grazing land covers more acreage than crops, while urban areas occupy about 3%. USDA’s 2022 figures reveal how America’s land is divided.
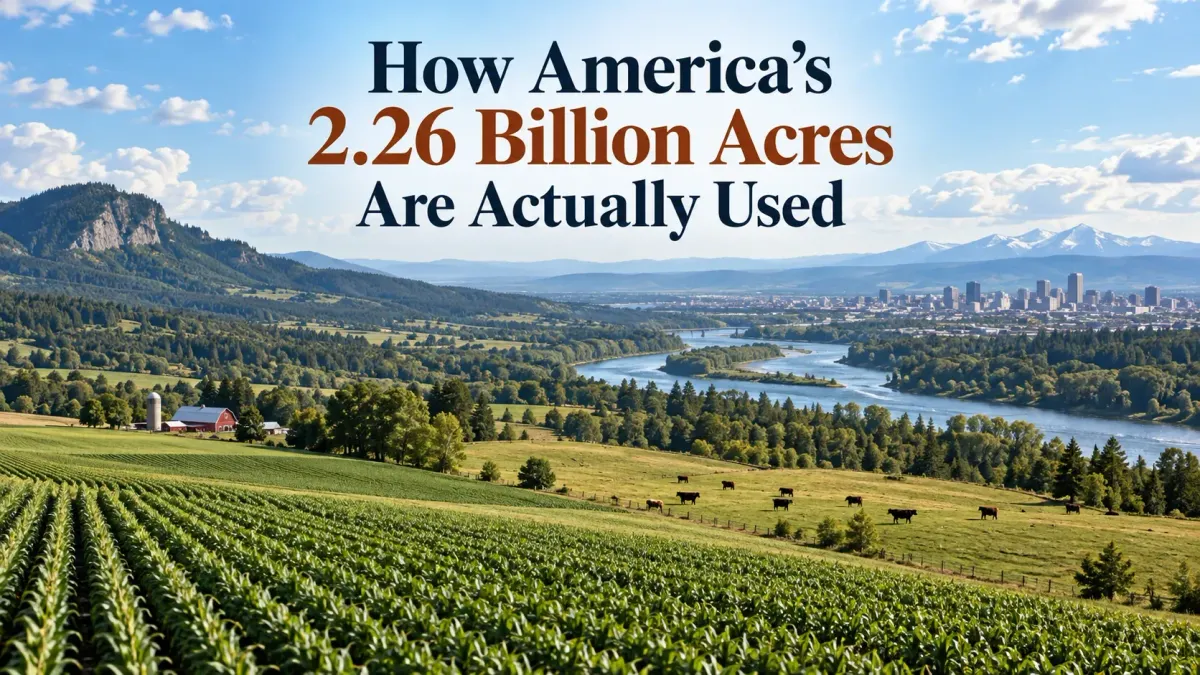
A commute past new subdivisions, shopping centers and road construction can make it seem as though America is steadily disappearing under pavement. Measured across the whole country, though, that familiar view occupies a small corner of the map. The USDA’s 2022 land-use accounting puts urban areas at about 66 million acres—roughly 3% of the United States’ 2.26 billion acres.
Grassland pasture and range covered 653 million acres, compared with 377 million acres of cropland. Include grazed forests and farm infrastructure, and agricultural uses accounted for about 51% of the country. That broad definition matters: much of the land supporting American agriculture looks nothing like a field of corn. (USDA Economic Research Service)
These are figures for all 50 states, including Alaska and Hawaii, from the USDA’s Major Land Uses update released in August 2026. The comprehensive breakdown describes land use in 2022; it is a national snapshot, rather than a live count of construction or farming activity.
U.S. Land Use by Category and Percentage
| Land-use category | Acres, approximately | Share |
|---|---|---|
| Grassland pasture and range | 653 million | 29% |
| Forest-use land | 618 million | 27% |
| Cropland | 377 million | 17% |
| Special-use areas | 323 million | 14% |
| Miscellaneous other land | 224 million | 10% |
| Urban areas | 66 million | 3% |
USDA 2022 estimates, released in 2026; figures rounded. The 51% agricultural share includes parts of several categories above and should not be added as another category. Source: USDA national summary.
Grassland and Range Cover More Land Than Crops
Rows of corn and wheat are the obvious image of American agriculture. Acreage gives grazing land the larger role. At approximately 653 million acres, grassland pasture and range occupied about 29% of the national land base and roughly 1.7 times the area classified as cropland.
The category includes nonforested grazing land both on farms and outside them. It also encompasses shrub and brushland used for pasture, so the word “grassland” should not conjure one continuous, neatly tended meadow. USDA’s definition covers a much more varied working landscape. (USDA land-use definitions)
For the national picture, that distinction changes how we read the agricultural total. Cultivated fields account for only part of it; grazing extends the footprint well beyond the land planted with crops.
What America’s 377 Million Acres of Cropland Include
Cropland accounted for about 377 million acres in 2022, or roughly 17% of the country. The total includes land used for crops, idle cropland and cropland used as pasture. Reading it as 377 million acres actively producing a harvest would overstate what the number tells us. (USDA Major Land Uses)
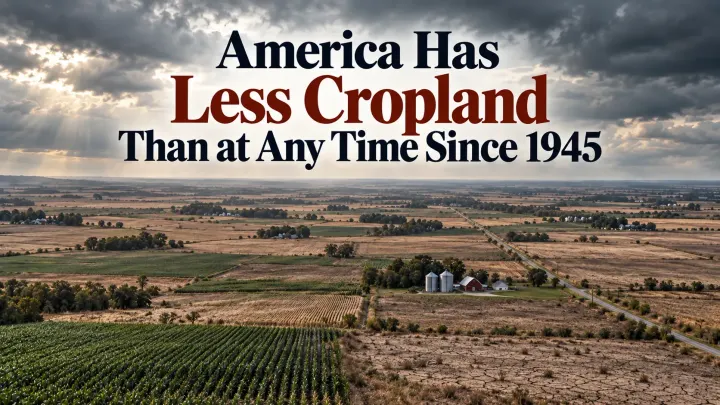
The longer trend is downward: USDA reports that cropland acreage was about 18% below its 1959 level. Our closer look at why America has less cropland than at any time since 1945 puts that decline in a longer historical context. Acreage alone is an incomplete measure of agriculture’s productive capacity. (USDA historical comparison)
Changes in crop genetics, equipment and farm practices have helped agriculture increase output without a matching increase in resources. USDA’s separate productivity research tracks that relationship across land, labor, machinery and other inputs. A smaller cropland footprint can therefore coexist with greater production; the land-use figures and the production figures answer different questions. (USDA agricultural productivity findings)
Forest-Use Land Accounts for About 618 Million Acres
Forest-use land occupied approximately 618 million acres, about 27% of the United States. It was the second-largest category after grassland pasture and range. Within that total, roughly 118 million acres were grazed forestland. (USDA 2022 national summary; grazed forestland figures)
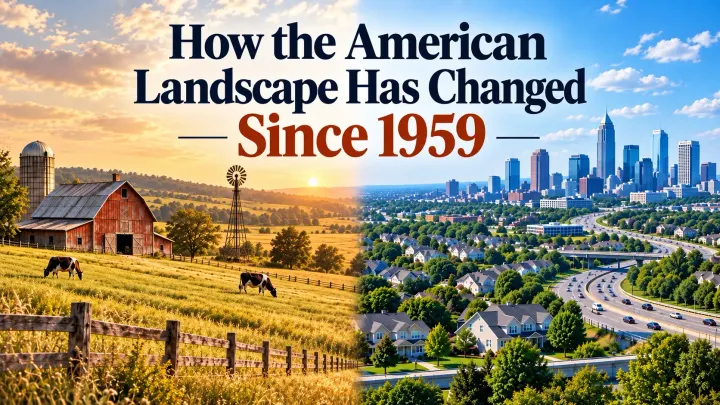
The grazing component was about 52% smaller than in 1959. That decline applies specifically to grazed forestland; it does not mean the country lost half its forests. Our comparison of how the American landscape has changed since 1959 follows the broader shifts across land-use categories.
There is another distinction worth keeping in mind when comparing these numbers with a map. USDA classifies land by use, so trees inside a park or wildlife area can fall under special-use land. The forest-use total is consequently different from a count of every acre with forest cover. (USDA forest-use definition)
Parks, Roads and Other Special Uses
About 323 million acres, or 14% of the land base, were classified as special-use land. The label brings together places with very different purposes: parks and wildlife areas, rural transportation, defense and industrial areas, and farmsteads and related uses. (USDA 2022 national summary)
A wildlife refuge and a rural highway belong here for different reasons. That makes this a useful accounting category, but a poor shorthand for either protected wilderness or developed land. Together, cropland, grassland pasture and range, forest-use land and urban areas still leave more than half a billion acres in special and miscellaneous uses. (USDA category definitions)
Alaska alone contributed about 146 million acres of special-use land—roughly 45% of the national category. Its scale has a large influence on the all-state totals, which is one reason a national percentage may look unfamiliar to someone picturing the landscape closer to home.
The remaining major category, miscellaneous other land, covered about 224 million acres, or 10%. It includes deserts, tundra, marshes and other uses outside the preceding groups, including some rural developed sites. This is the balance of the accounting, rather than a reserve of vacant land awaiting a purpose. (USDA acreage totals; miscellaneous-land definition)
Urban Land Is About 3% of the Country
Urban land has nearly tripled in acreage since 1959, a change that its small national share can easily obscure. Both observations can be true: cities have expanded substantially while remaining a small part of a very large country. (USDA urban land figures)
That 3% also needs careful handling. Rural roads and other infrastructure appear in separate categories, so it is not a count of every developed acre. Nor does it tell us how much land is available for homes near a particular city. A national total says little about a site’s access to jobs, water, transport or existing services.
Comparisons with the previous update require care, too. The apparent decline in urban acreage between 2017 and 2022 reflects a change in the Census Bureau’s urban-area definition. USDA cautions against interpreting that shift as cities physically shrinking. (USDA update and revision history)
For a closer look at the businesses supplying new residential developments, see our ranking of the largest homebuilders in America, measured by annual home closings.
What the National Map Leaves Out
The acreage figures are a useful correction to the landscape visible through a windshield. They show the scale of grazing, forestry and farming beyond the developed places we pass every day. They also leave room for local experiences that seem to contradict the national picture.
A town can lose familiar fields to new housing while urban land remains a small fraction of America. Understanding that change means looking more closely at where development is happening and which uses it replaces. The USDA totals give us the broad outline; the pressure on any particular community sits inside it.
Source
Primary data: USDA Economic Research Service, Major Land Uses, updated August 2026, including Summary Table 1 for 2022. Acreages and shares are rounded. The roughly 51% agricultural share includes components of the forest-use and special-use categories; it should not be added to the six major land-use categories as another category.
Continue Reading
Recommended